
In Release #4, we introduced Real-Time Metrics by giving our partners visibility into their pharmacy’s financial performance at the claim level.
With Release #7, we’re taking that foundation to the next level. Our new Advanced Metrics Dashboards give Covered Entities a 360° view across financial, pharmacy, and patient performance all in one place and as always in real-time.
🔍 Release #7 Highlights =>
✅ Financial Breakdown & Projections
✅ Workflow-Level Pharmacy Metrics
✅ Patient Growth Tracking
✅ Drilldown by NDC orPatient
✅ Month-over-Month Comparisons
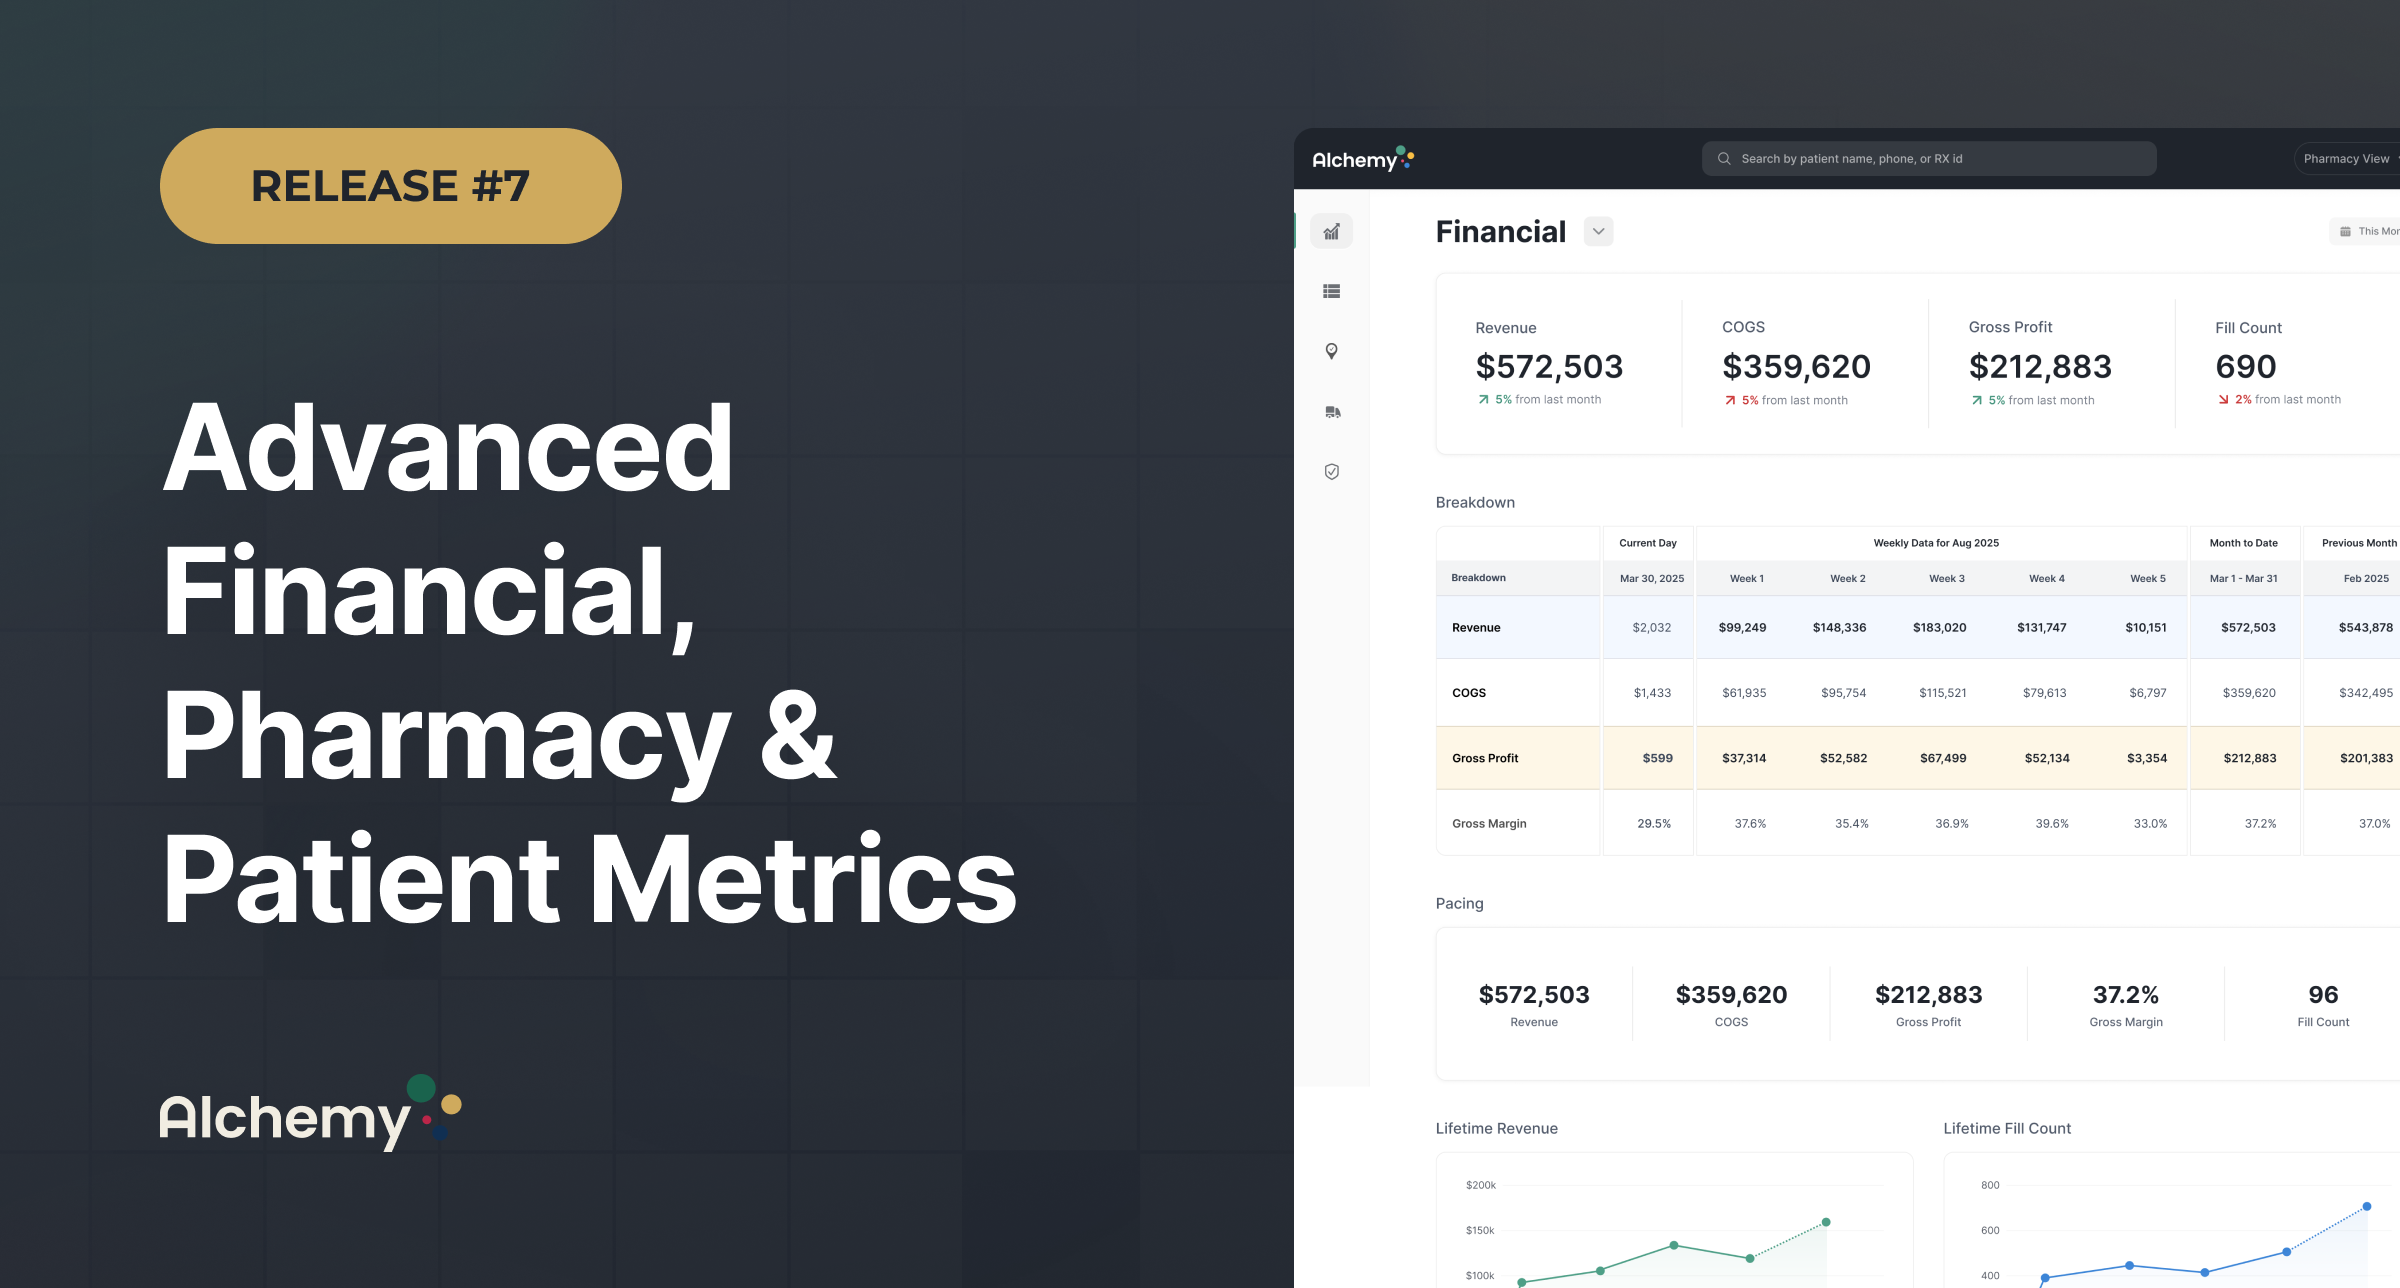
💰 Financial Metrics 2.0 – Go Beyond the Top Line
We’ve expanded our financial dashboard to include month-over-month performance, pacing projections, and detailed gross profit analysis.
New capabilities include:
- Monthly Financial Breakdown: Compare daily, week-over-week, and month-to-date totals alongside the previous month.
- Drilldowns by Prescription & Patient: Click on any hero metric to see detailed revenue, COGS, and gross profit by prescription or patient.
- NDC-Level Trends: Review average reimbursements and COGS month-over-month, along with fill counts and margin trends.
- Missed Opportunity Detection: Automatically surface prescriptions with above-average COGS or below-average gross profit so you can course-correct before month-end.
- Revenue & Fill Count Pacing: See real-time projections for current month performance based on actual daily trends.
These metrics transform what used to be static, end-of-month reports into real-time, actionable insights that drive smarter decision-making and more predictable 340B proceeds.

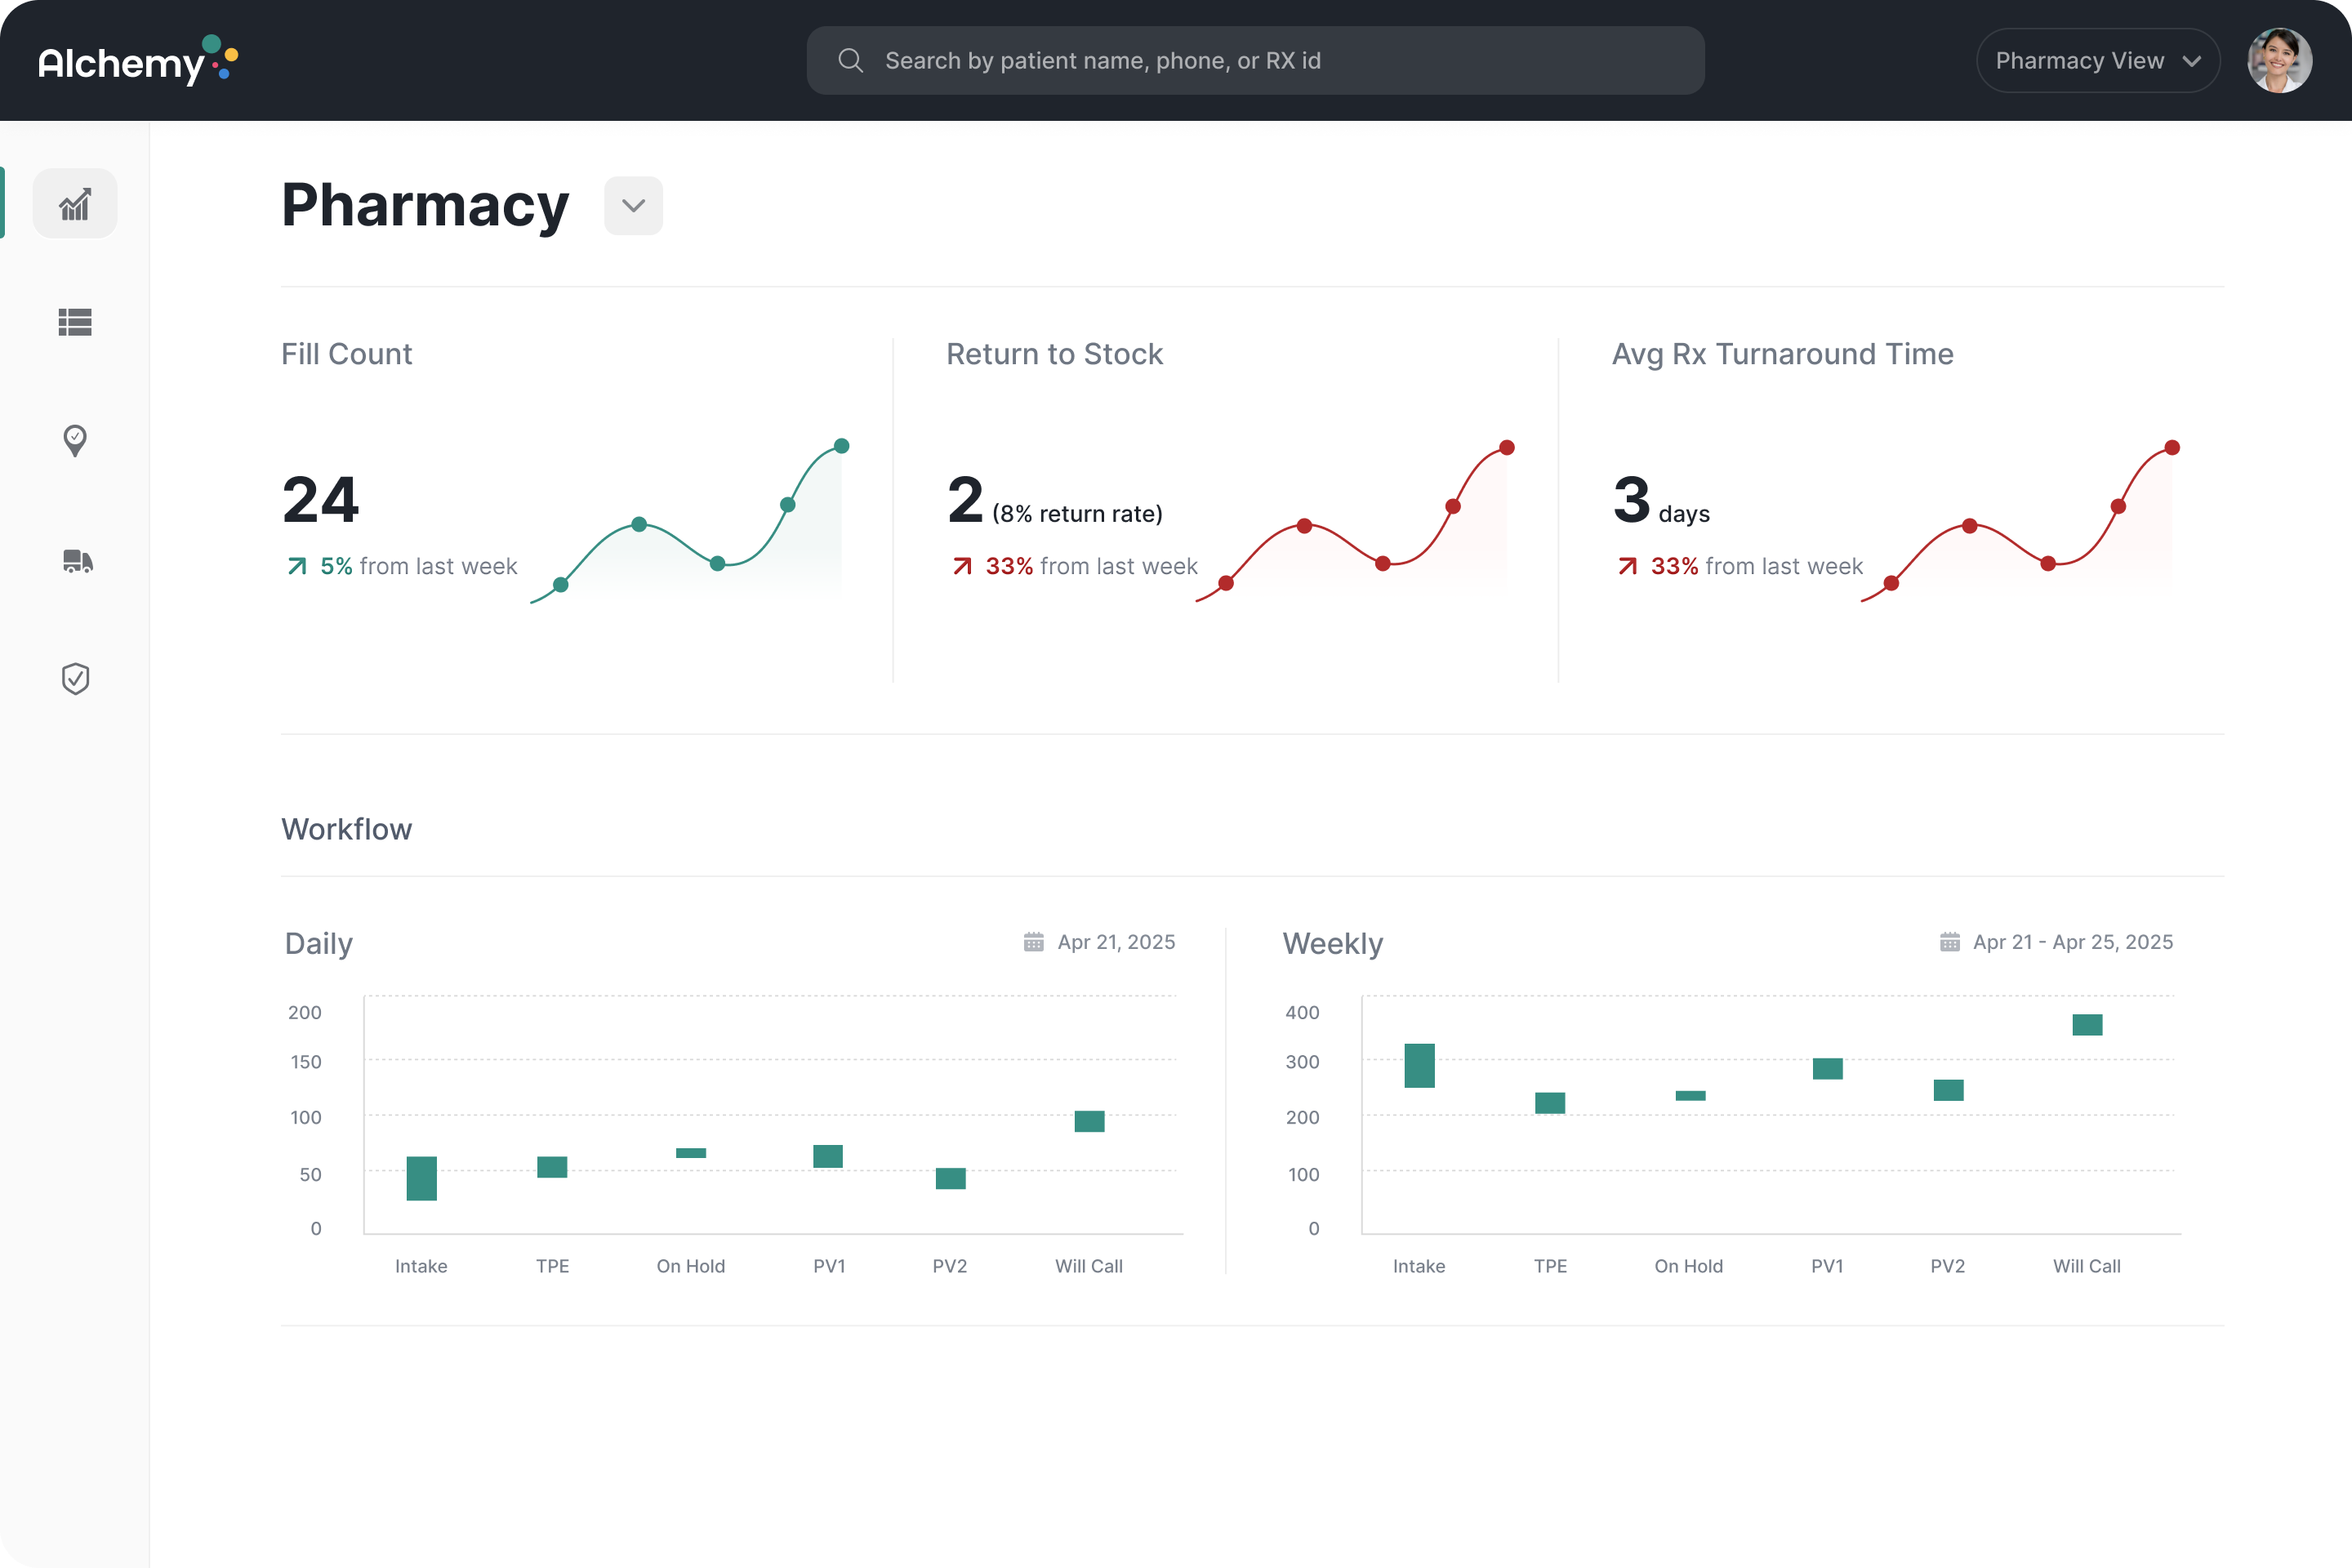
⚙️ Pharmacy Metrics – Operational Clarity from Intake to Will Call
Your operational efficiency directly impacts your capture rate and patient satisfaction. The new Pharmacy Dashboard brings visibility into every workflow step from prescription intake to final pickup.
Highlights include:
- Hero Stats: Completed fills, return-to-stock, and average turnaround time.
- Week-over-Week Trends: Quickly see how your operations are improving (or slowing down) over time.
- Workflow Analytics: Drill down into daily and weekly graphs showing queue volumes for each workflow step.
- Root Cause Insights: Identify where fills are aging — whether due to intake issues, third-party exceptions, or bottlenecks in PV1/PV2.
- Source Tracking: Understand where prescriptions are coming from (e-script, fax, or transfers) to optimize referral patterns.
By quantifying every part of the pharmacy workflow, you can pinpoint where efficiency gains will have the greatest financial and patient impact.
🧑🤝🧑 Patient Metrics – Tracking Growth, Retention & Adherence
Covered Entities are more than pharmacies — they’re care networks. Our Patient Dashboard now gives you visibility into how your patient base evolves over time.
What’s new:
- Patient Count Graph: View total, new, active, and inactive patient trends.
- Breakdown Tables: Understand exactly who your high-value patients are.
- Adherence Metrics (coming soon): Track refill behavior, medication possession ratios, and adherence gaps.
With these insights, clinics can better understand how pharmacy performance connects to patient outcomes, a critical step toward closing care gaps and improving continuity of care.

Why It Matters?
340B success depends on mastering three core levers: Financial visibility, Operational visibility, Patient visibility – to improve care and capture. Release #7 brings all three together under one intuitive dashboard, so leadership teams, pharmacy staff, and finance teams can all make data-driven decisions together.
Your 340B data deserves to work for you, not the other way around.


